
Real-Time Force vs Depth vs Time Diagrams for Advanced Hardness Testing
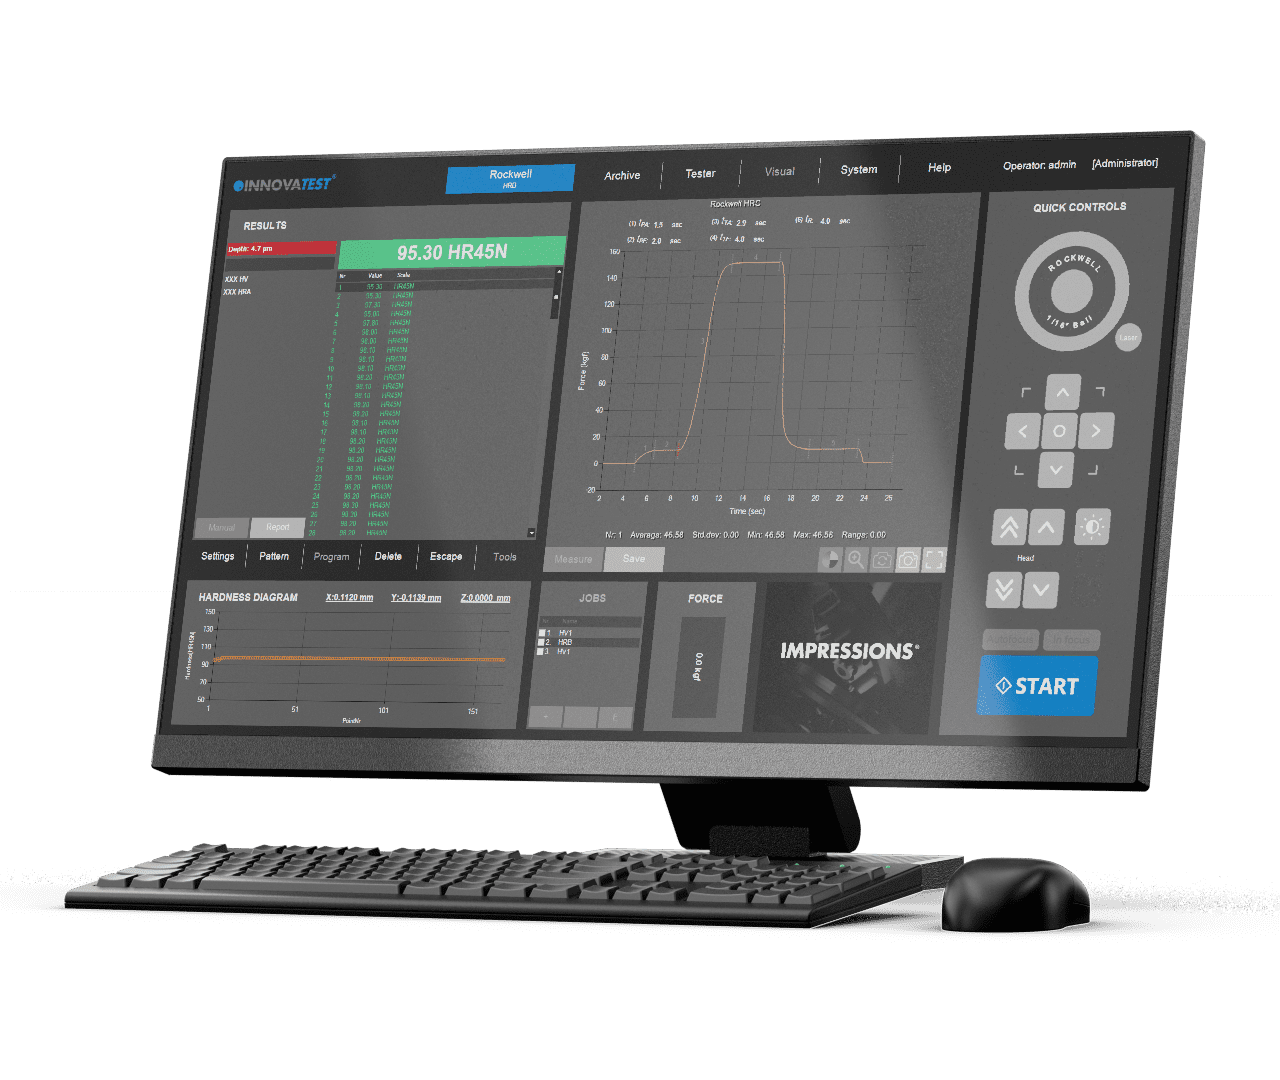
The IMPRESSIONS™ real-time Force vs Depth vs Time Diagram module provides a powerful visual representation of the hardness testing process during Rockwell hardness testing and other depth-based hardness measurements.
By displaying the exact relationship between applied force, indenter penetration depth, and test duration, this feature gives operators deeper insight into the testing process—far beyond what is possible with traditional analogue or purely numerical hardness testers.
This enables improved test validation, faster troubleshooting, and greater confidence in every measurement.
Live Visualization of Indenter Depth During Rockwell Testing
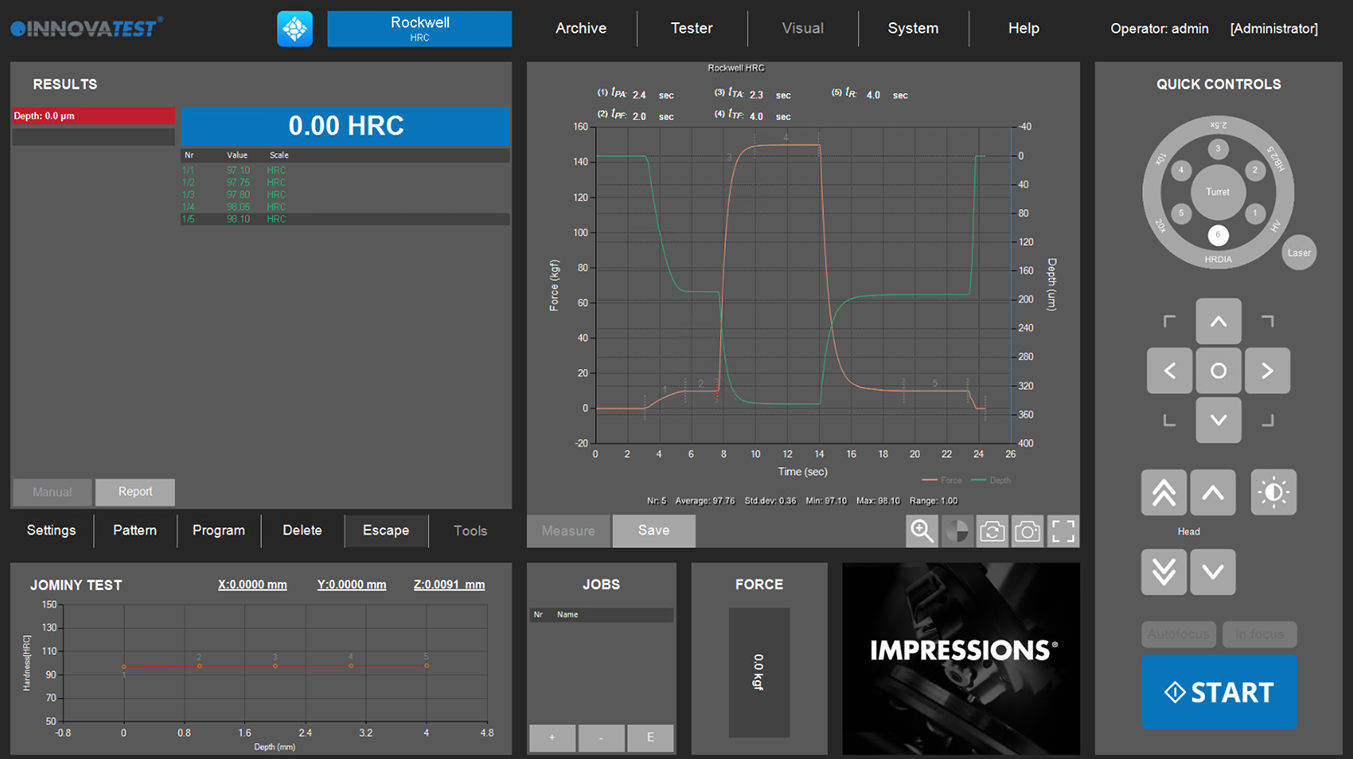
During a Rockwell hardness test, the system continuously monitors and displays the movement of the indenter as force is applied to the sample.
This allows operators to clearly see how the material responds during testing, rather than relying only on the final hardness value.
Force vs Depth Diagram for Process Verification
The force/depth diagram provides a clear graphical view of the relationship between applied force and indentation depth.
This visual analysis helps operators verify:
This makes it easier to identify potential issues before they affect final results.
Detect Errors Before They Impact Results
Traditional hardness testers often provide only the final hardness value, making it difficult to identify testing errors or irregularities.
With real-time depth monitoring, users can quickly detect:
This improves reliability and reduces the risk of inaccurate measurements.
Integrated Reporting with Graphical Test Evidence
The Force vs Depth vs Time graph can be directly included in the IMPRESSIONS™ Report Generator, providing valuable visual proof of the testing process.
This transforms reporting from simple numerical output into a more complete and professional technical document.
Real-Time Digital Analysis vs Traditional Analogue Hardness Testing
Conventional Rockwell hardness testers often rely on analogue dial readings or basic digital outputs that provide limited insight into the test process.
The IMPRESSIONS™ real-time diagram offers a significant advantage:
Traditional Hardness Testing Limitations
IMPRESSIONS™ Real-Time Diagram Advantages
This creates a more transparent and reliable hardness testing process.
Applications of Force vs Depth Monitoring
This functionality is especially valuable in applications where process validation and depth accuracy are critical:
Better Insight, Better Hardness Testing
By combining real-time visualization, advanced diagnostics, and integrated reporting, the Force vs Depth vs Time Diagram module brings a new level of control to hardness testing.
The result is improved accuracy, stronger quality assurance, and a deeper understanding of material behavior—making it an essential tool for modern Rockwell and depth-based hardness testing environments.